Reiter
This course is no longer offered and was replaced by the Visual Computing Project.

Description
Scientific computing is an essential building block in many scientific disciplines. Over the past years, the data complexity has increased rapidly in terms of size, dimensionality, and in the number of variables. In this group project, we will interactively visualize such scientific data sets, arising in fields such as climate science, cosmology, oceanology, fluid dynamics and geosciences.
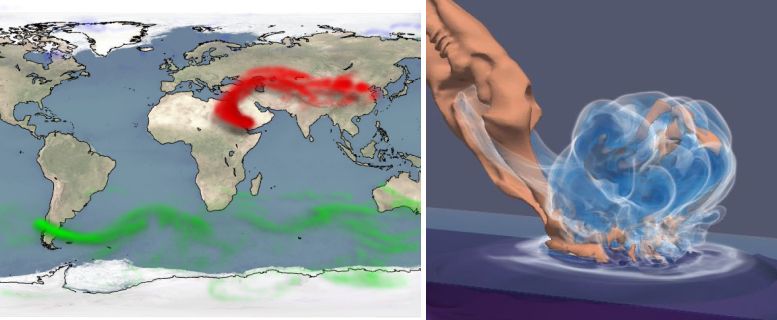
In teams of 3-4 students, a scientific data set of choice is processed and visualized. Students are free to choose from a given set of data sets, including satellite measurements of volcanic eruptions, salt ensemble simulation, cosmology simulation, asteroid impact simulation, vortex street, weather simulation, ocean eddy simulation, Earth mantle convection, and wildfire simulation. During the first weeks, we develop a demo visualization system together, which will contain basic functionality such as direct and indirect volume rendering, as well as particle tracing. The group projects can be built on top of this demo system.
Content
The group project is accompanied by a lecture, which covers implementation aspects of the following topics:
- introduction to VTK and the programming framework (C++),
- volume visualization (ray marching and marching cubes),
- differential multi-variate calculus (scalar and vector fields, discretization),
- numerical integration of particle trajectories (explicit integration schemes),
- shader programming (for direct volume rendering),
- image-based flow visualization (line integral convolutions),
- vector field topology (critical point extraction and classification),
- parallel vectors operator (feature definitions and numerical extraction),
- vortex extraction (region-based and line-based techniques),
- Lagrangian coherent structures (finite-time Lyapunov exponents),
- reference frames (transformation and optimization),
Grading
The projects are graded based on a written report (approx. 7 pages, 75% of grade) and an oral presentation (15 minutes, 25% of grade). A LaTeX template for the report and Power Point templates for the presentations are provided.
Goals and Competences
Students are able to:
- implement interactive visualization algorithms
- analyze the features in the scientific data set
- present their progress and results orally
- write a report on their data analysis
Registration
The course is open for registration in the weeks prior to the start of the summer semester. At any other time, you can send your IdM to ✉ tobias.guenther@fau.de and ask for admittance into the StudOn course.